If you want to know more about this case study, please click here.
Customer Type:
Case:
Customer’s Request:
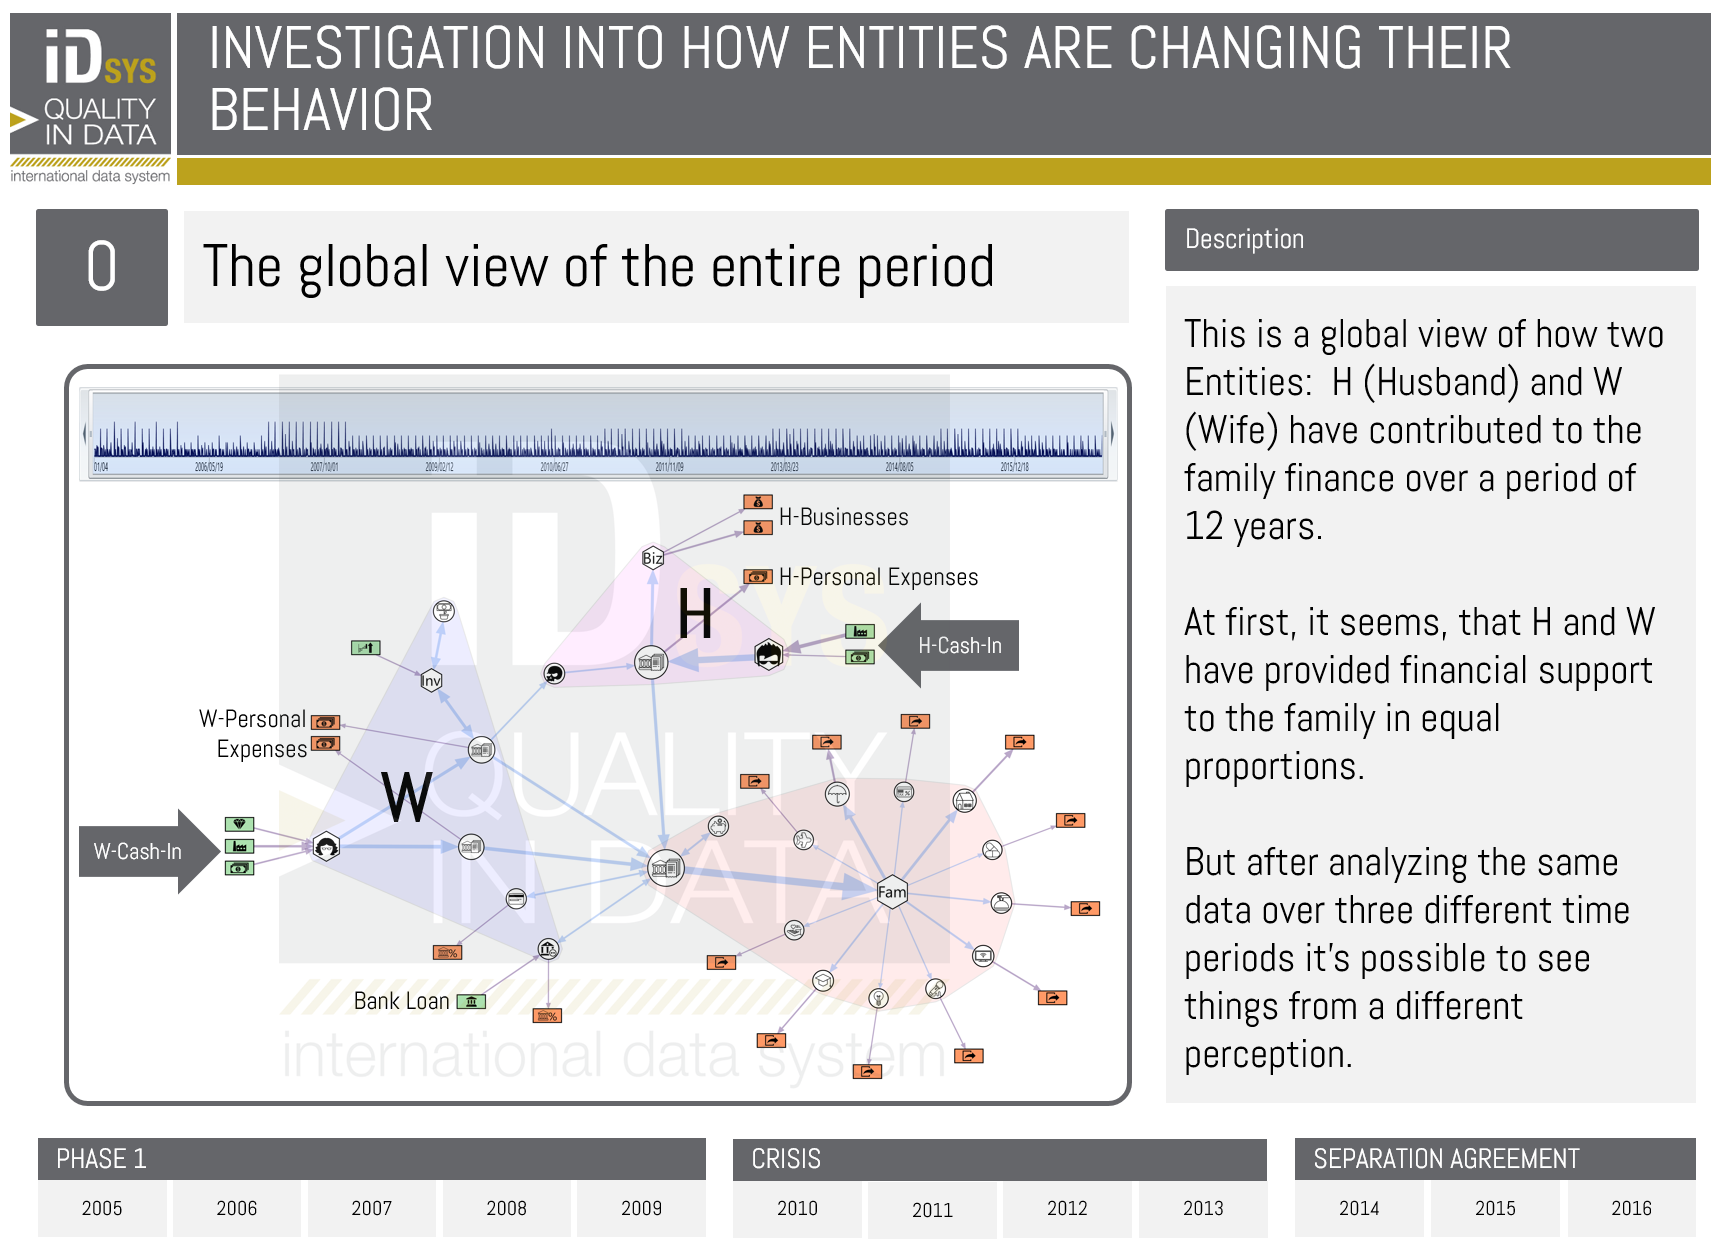
- Can you represent in one image 12 years of transactions made between the Husband, the Wife and the Family account?
- Can you provide evidence to support the fact that the Husband changed his behavior from a certain point in time to highlight the consequences?
Input Data:
- An Excel file containing 7,595 financial movements within 4 bank accounts.
- A report prepared by the Law Firm containing a description of what was already known to date
Outputs:
- 12 infographic representations
- 1 PowerPoint presentation
Delivery Time:
- Delivered within 20 days of validation of the database
Value:
- Subdivision of the 12 years into 3 separate periods of time
- A clear and easily understandable visualization of what happened during each period
- Less work for the Law Firm to prepare the Divorce claim
- Complex transactions became easy to read, even by laypersons
- Increase of the perceived value of the Law Firm’s outputs