The standard tabular analysis is no longer effective where there are groups of companies with extensive intercompany cash flow exchanges and transactions.
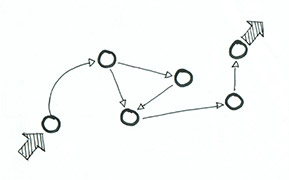
To properly understand various flux of business (in terms of purchases, sales, loans, quantities of products, etc) the only way to understand these is to use a visual tool.
The movements (intercompany and with third parties) are recognized with special “Flux Marks”, then it is then possible to create for every Flux Mark a serial of images and/or a movie to explain how those transactions developed during a certain period of time.