
The cash flow movements of an organization can be visualized from a complete and innovative new point of view: it’s is possible to graphically represent all the exchanges of financial means that happened within one large corporate within a certain period. NEED Understanding from the cash flow point of view…
Comments closedTag: Infographic
The IDSys Proactive Clusters Monitoring is a service with a new preventive approach to AML monitoring activities: it is able to monitor, with an graphical approach, groups of transfers of money executed between various Beneficial Owners. NEED In the presence of networks between Beneficial Owners there is an high risk…
Comments closed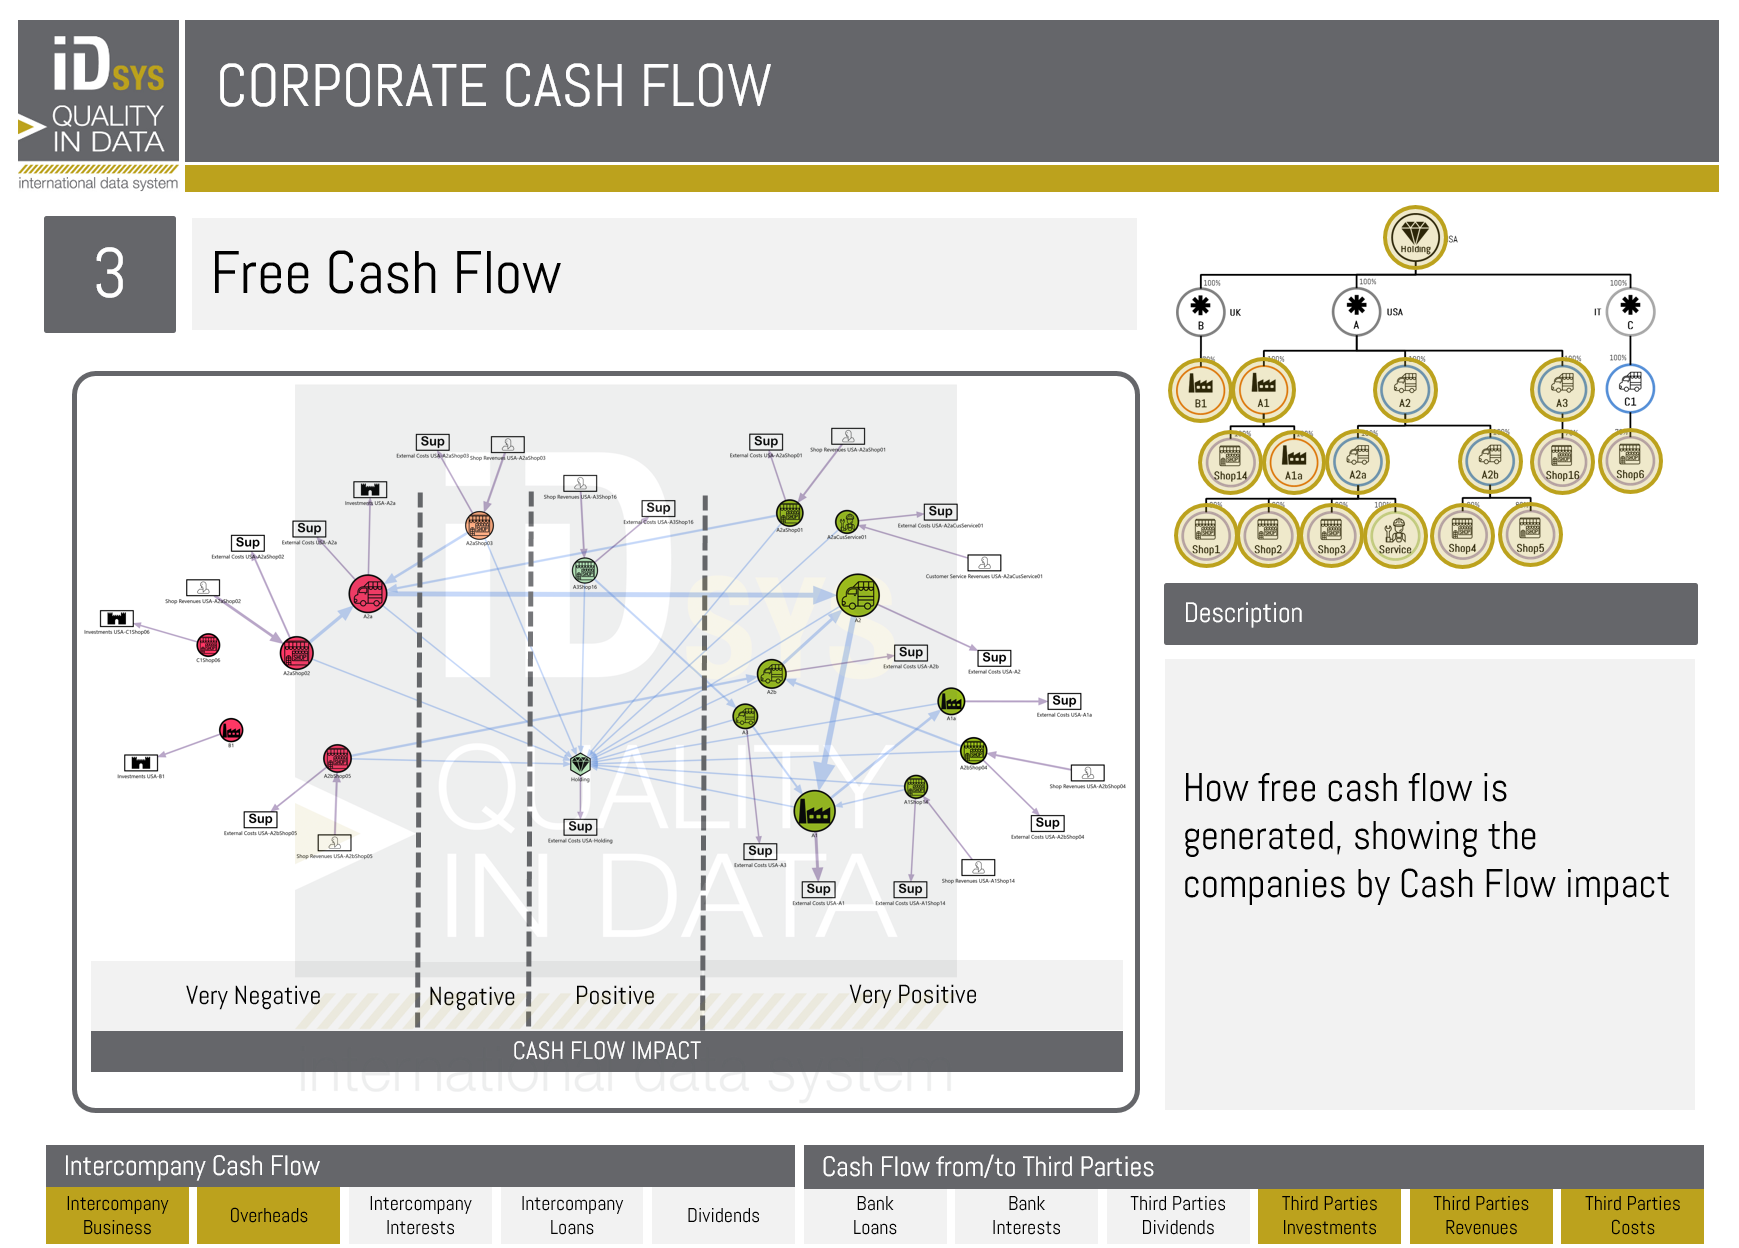
If you want to know more about this case study, please click here. Customer Type: Corporate Case: Cash Flow Analysis Customer’s Request: Can you show us all the cash flow movements within our group from a new point of view? Input Data: An Excel file containing one…
Comments closed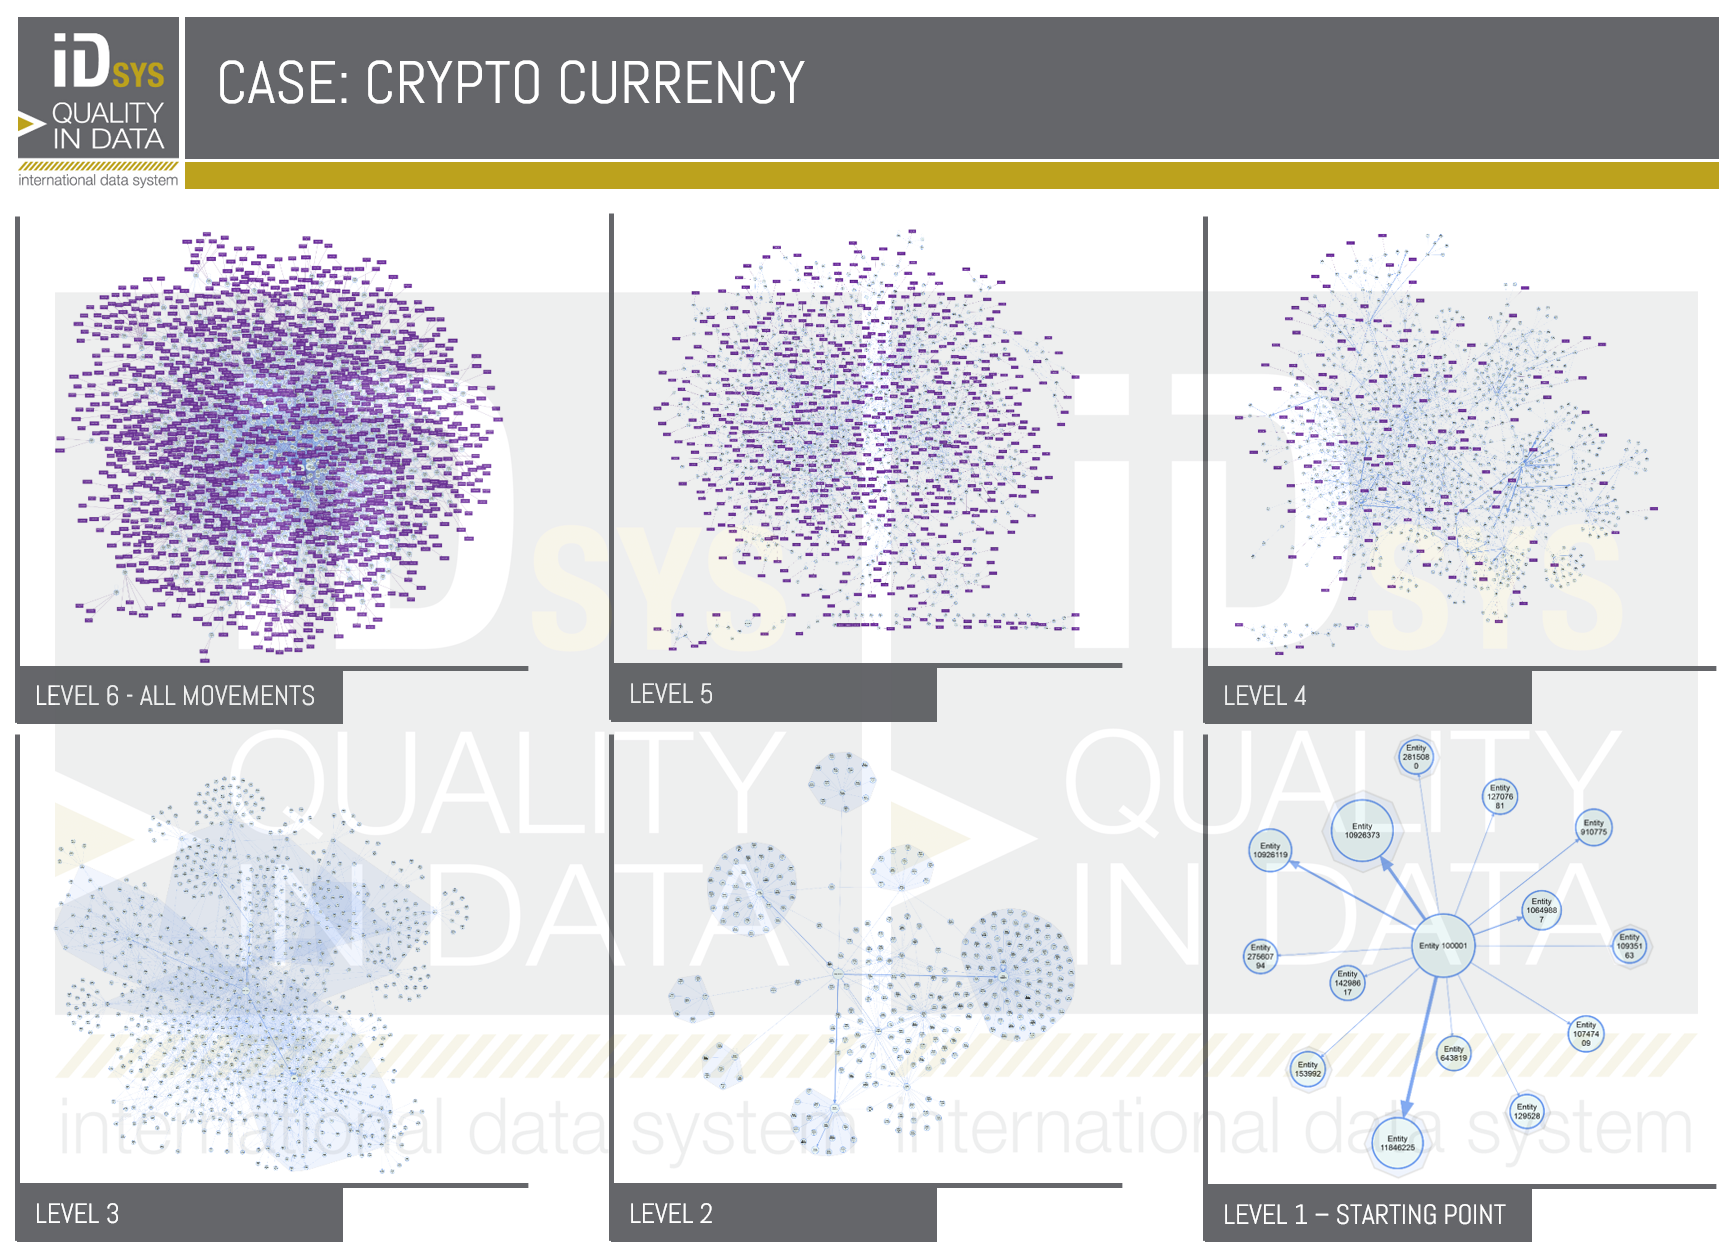
If you want to know more about this case study, please click here. Customer Type: Forensic Accounting Agency Case: Crypto currency analysis Customer’s Request: Can you provide us with an innovative approach to enable us to analyze complex databases of crypto currency transactions where all the parties…
Comments closed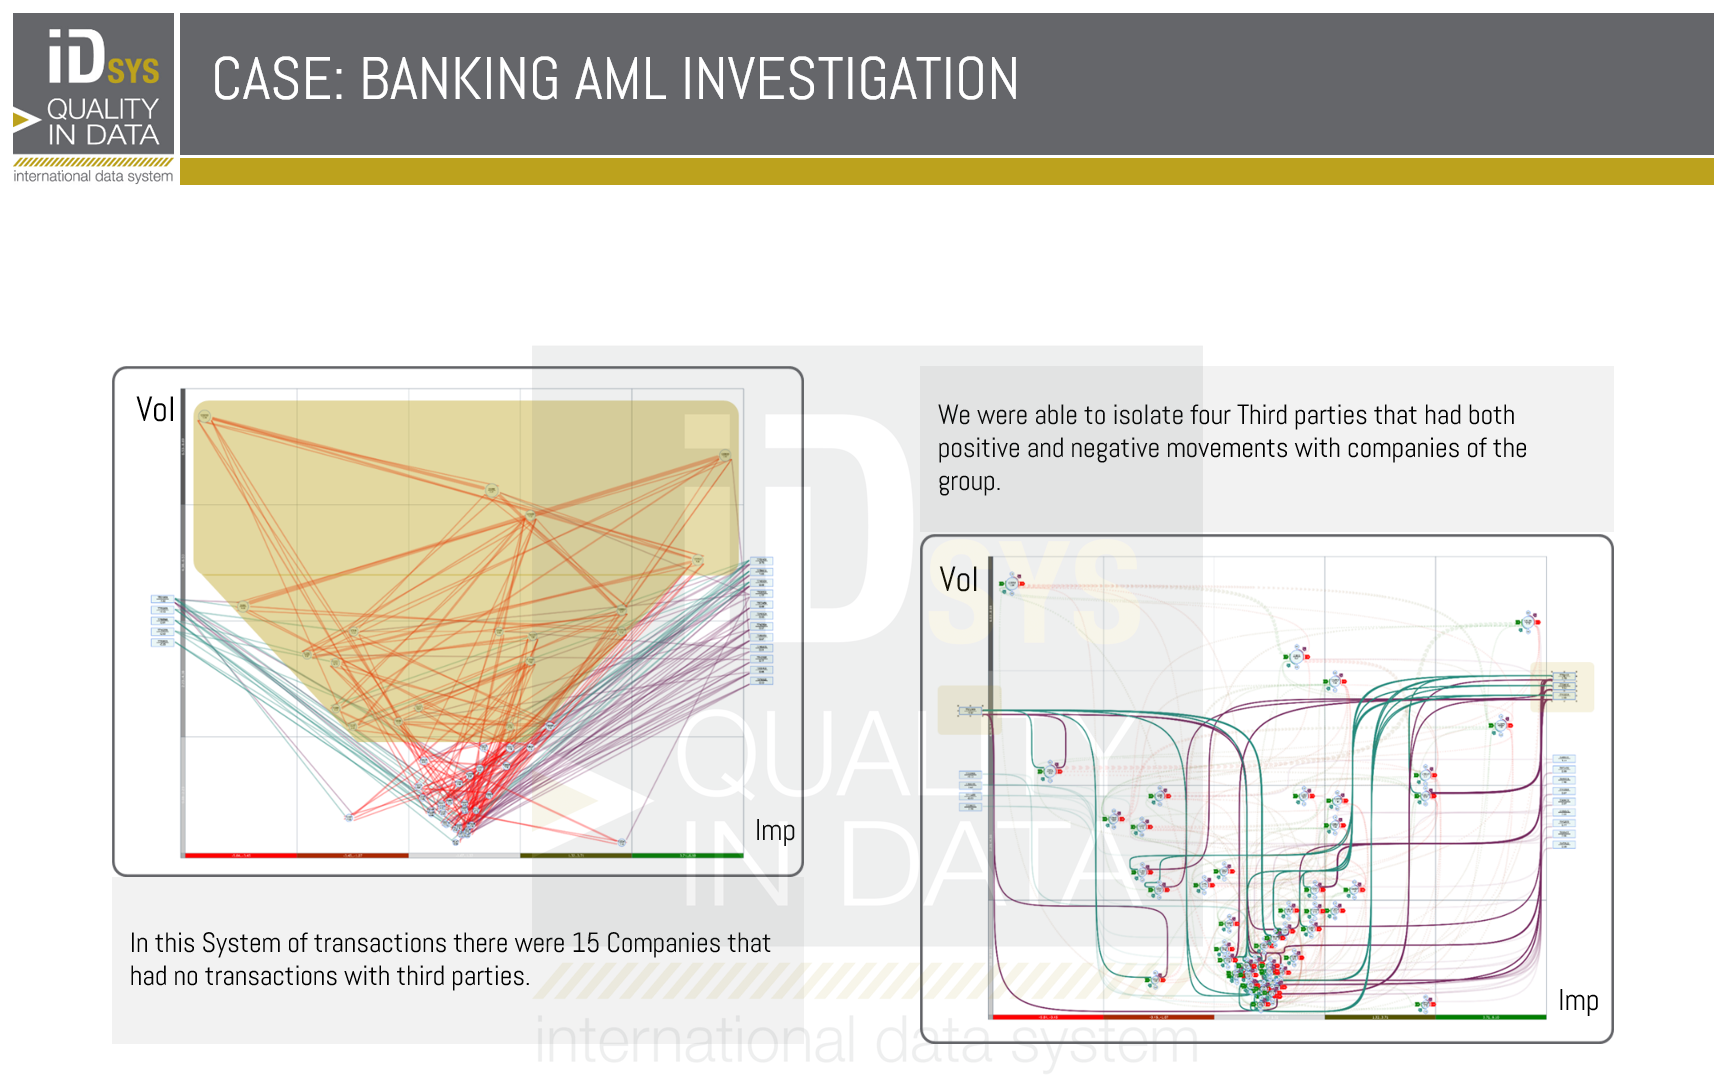
If you want to know more about this case study, please click here. Customer Type: Financial Institution Case: AML investigation Customer’s Request: Can you support us by providing an easy-to-read graphical representation all the financial movements between the 72 targets? Input Data: A text file in swift…
Comments closed
If you want to know more about this case study, please click here. Customer Type: Financial Institution Case: Credit card transactions Customer’s Request: Can you find a different way to monitor systems of credit card transactions highlighting transactions that are suspicious? Input Data: A CSV plain text…
Comments closed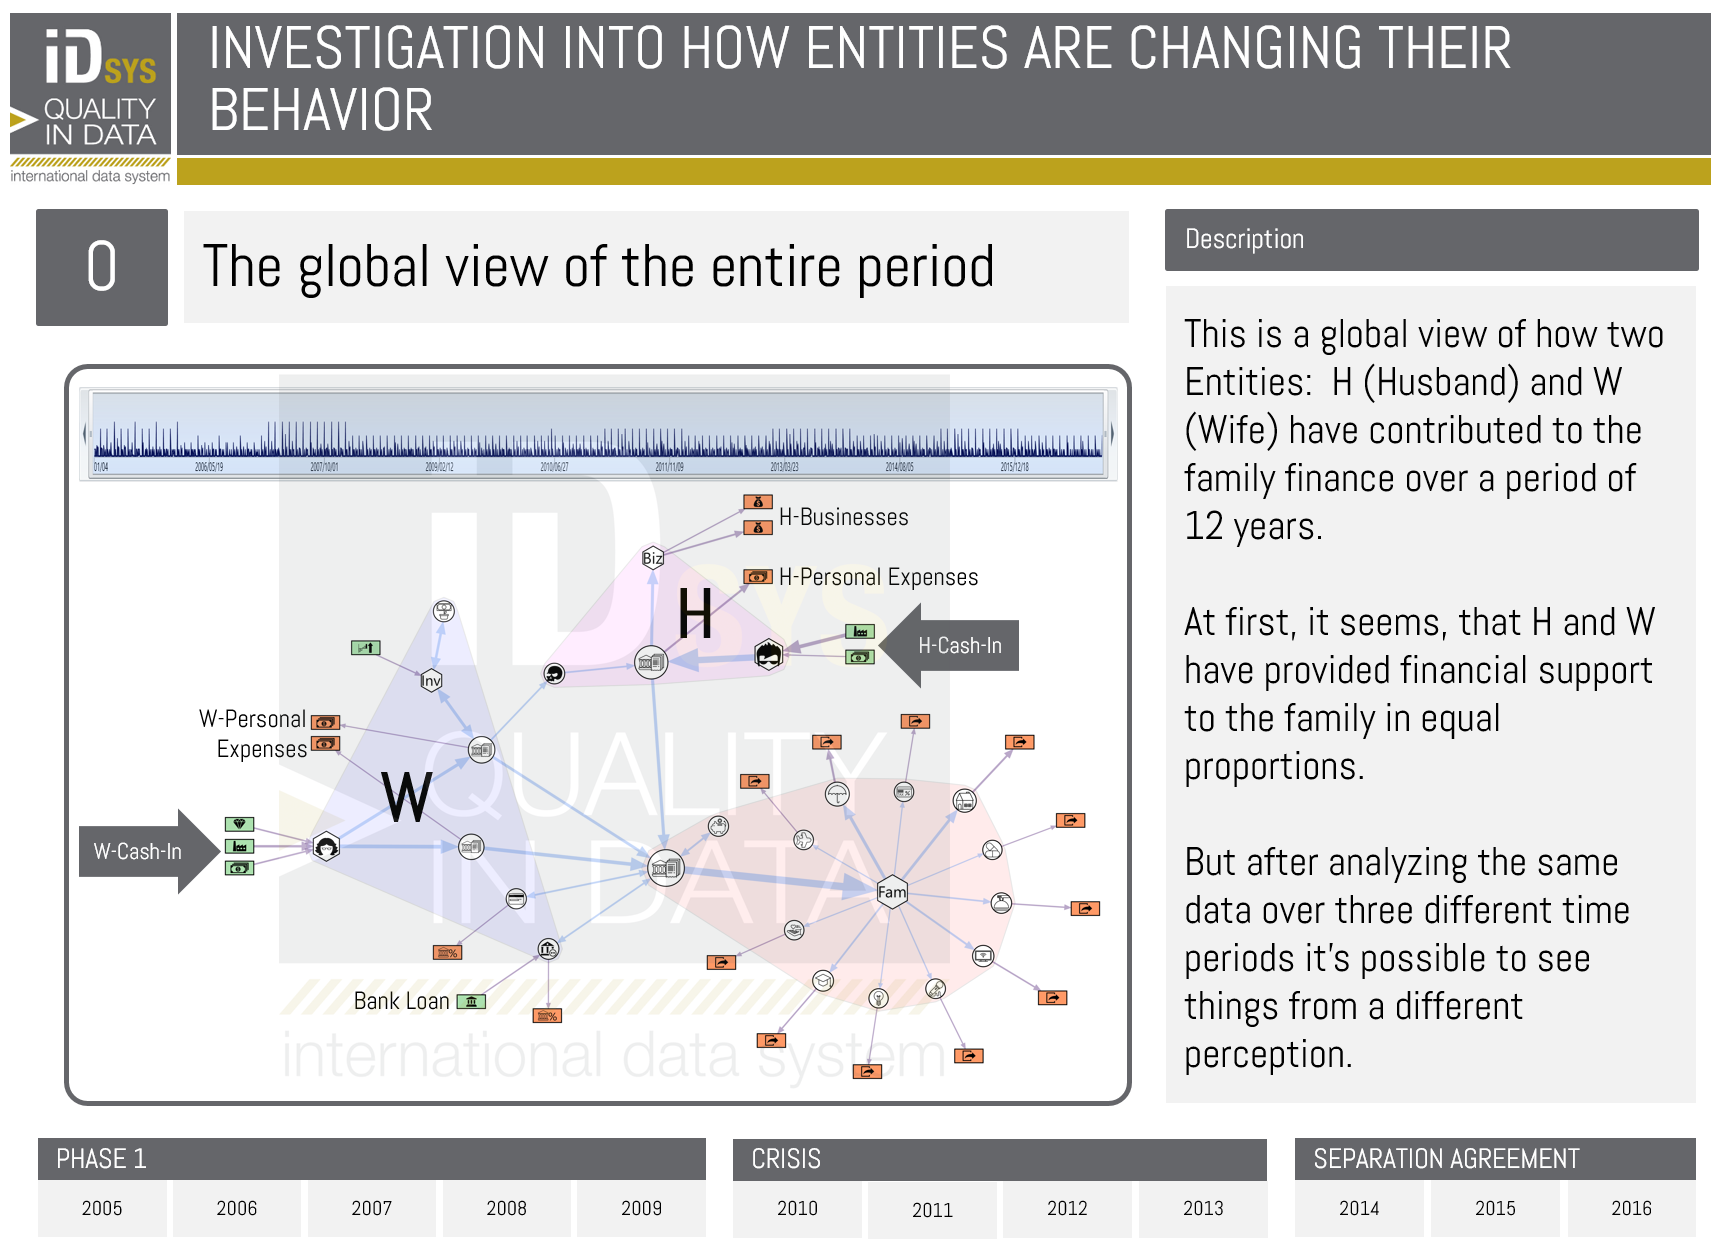
If you want to know more about this case study, please click here. Customer Type: Law Firm Case: Divorce Customer’s Request: Can you represent in one image 12 years of transactions made between the Husband, the Wife and the Family account? Can you provide evidence to support…
Comments closed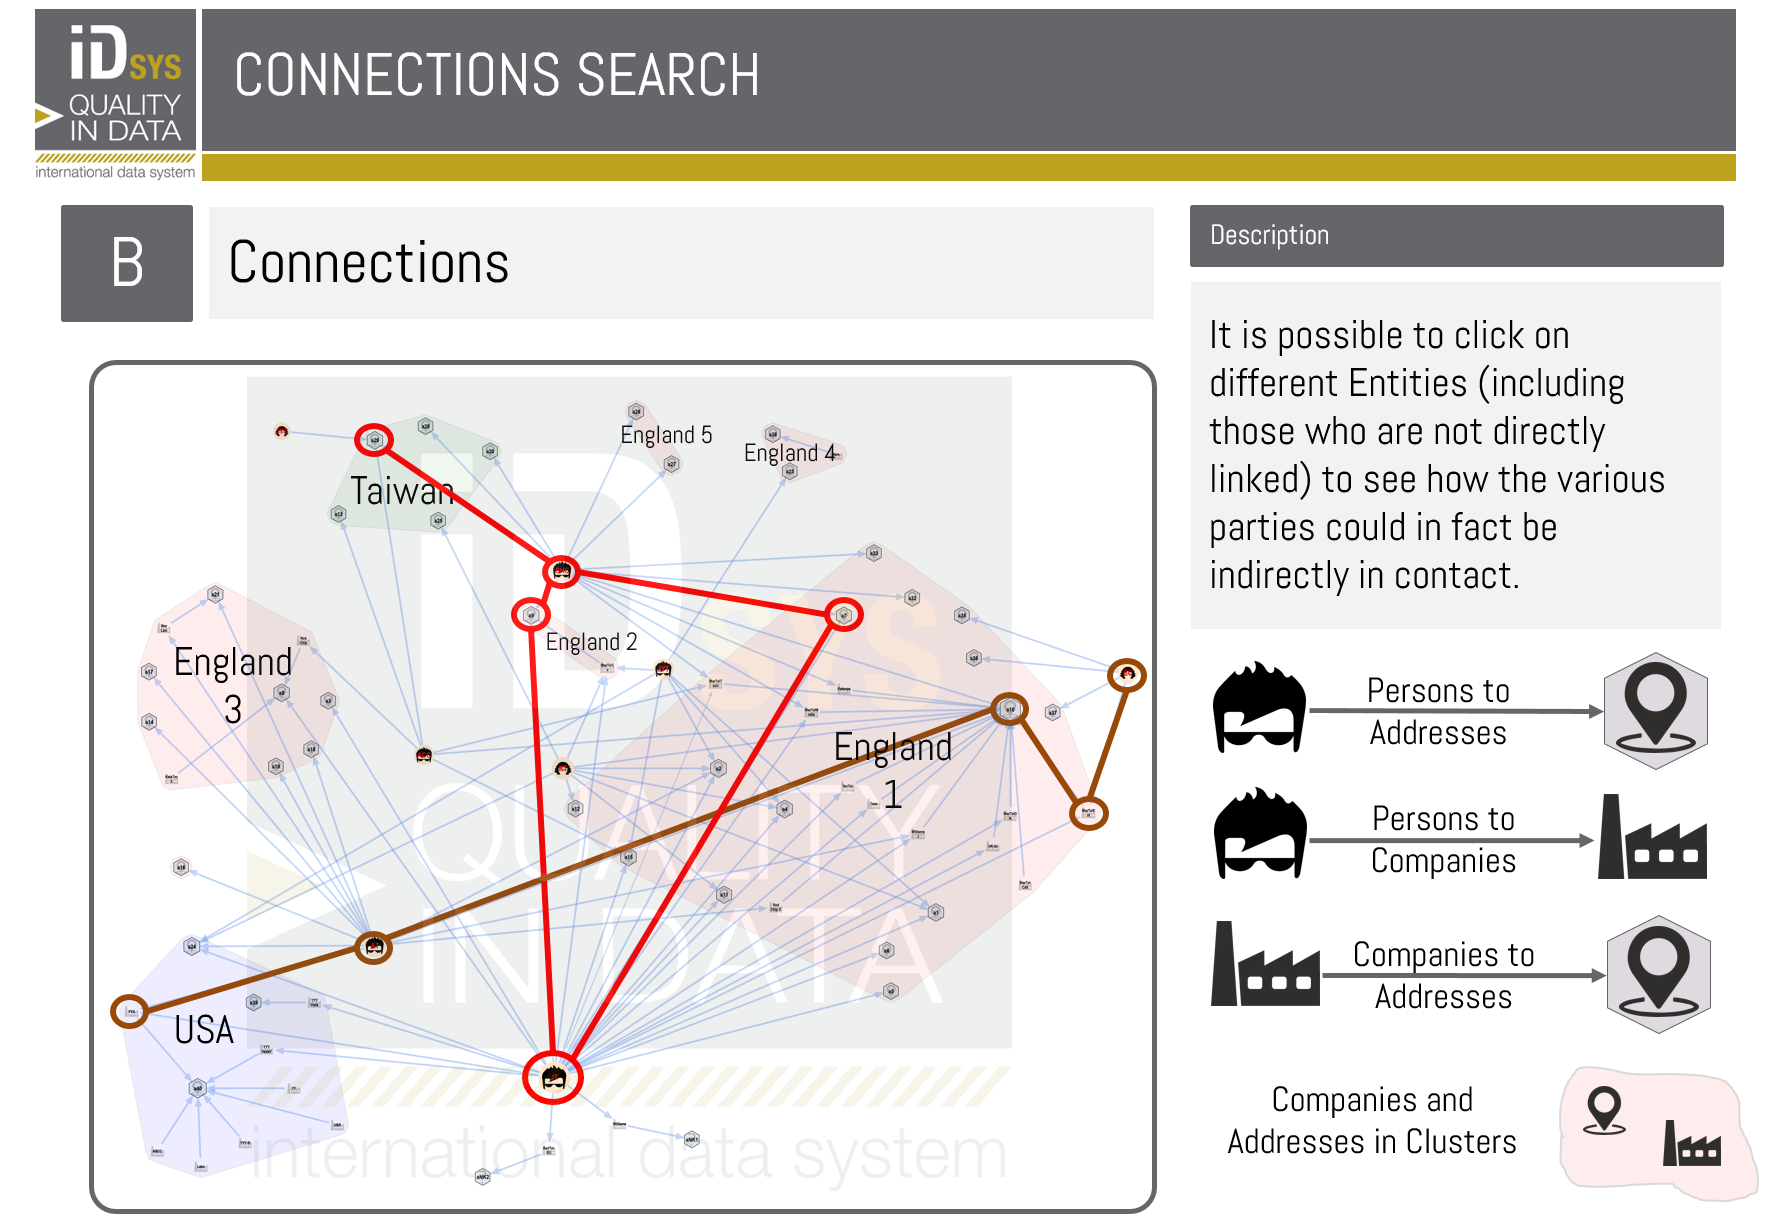
If you want to know more about this case study, please click here. Customer Type: Freelance Auditor Case: Identification and analysis of connections Customer’s Request: Can you prepare a graphical representation of the database of connections I have collected? Input Data: Excel file composed of 20+ worksheets…
Comments closed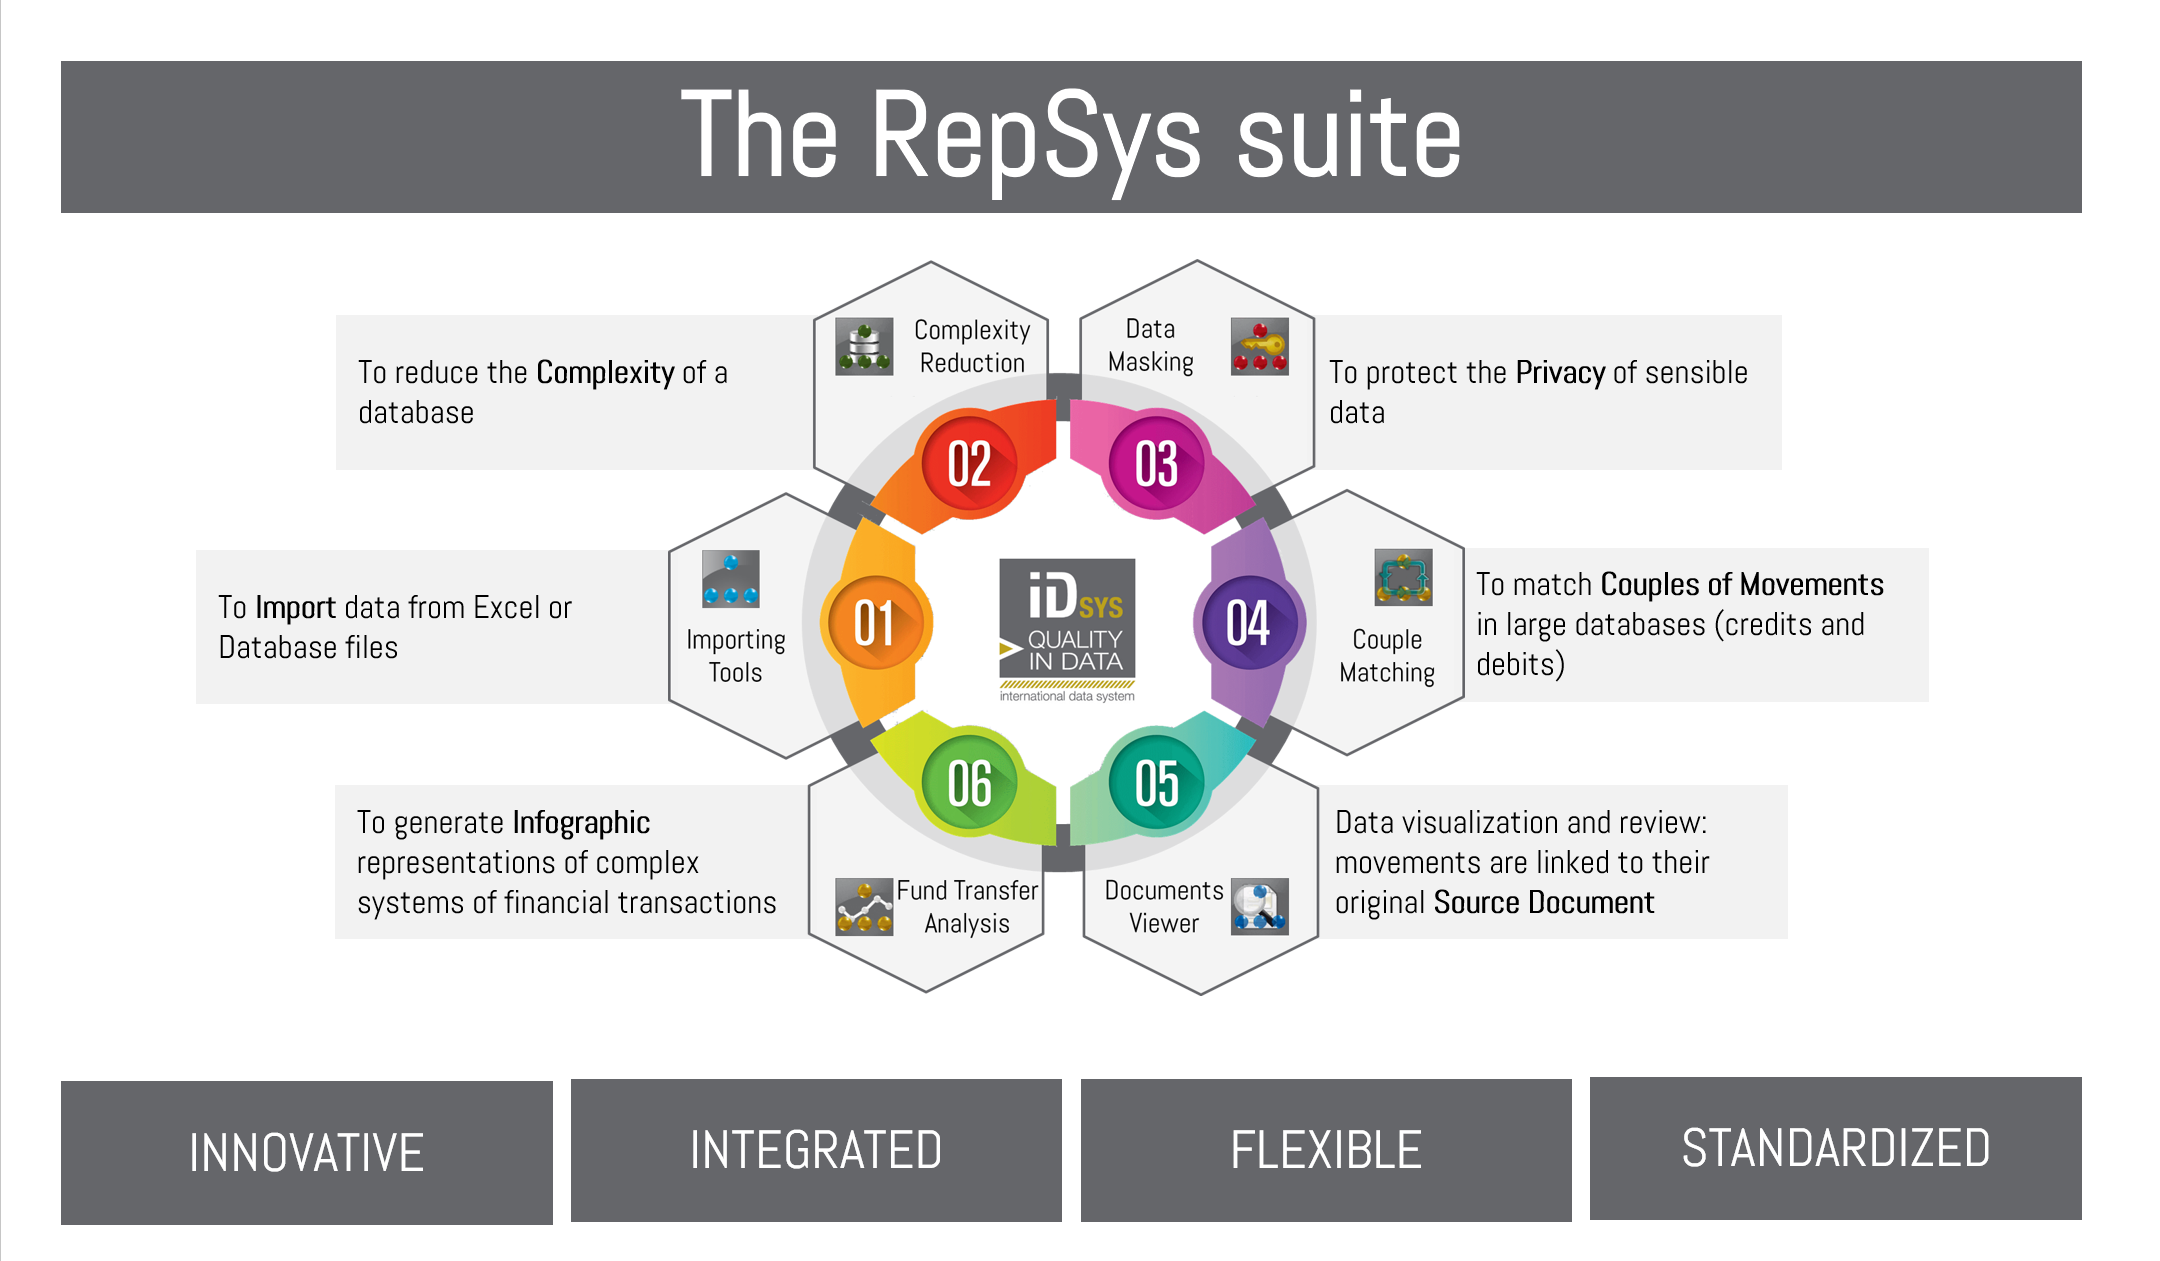
To render our services we use the RepSys suite. It is composed of six tools we have internally developed: Importing Tool Complexity Reduction Protect Privacy (Data Masking and Obfuscation) Couple Matching Documents Viewer Fund Transfer Analysis (Infographic Analysis) 1) Importing Tool To Import data from Excel or Database…
Comments closed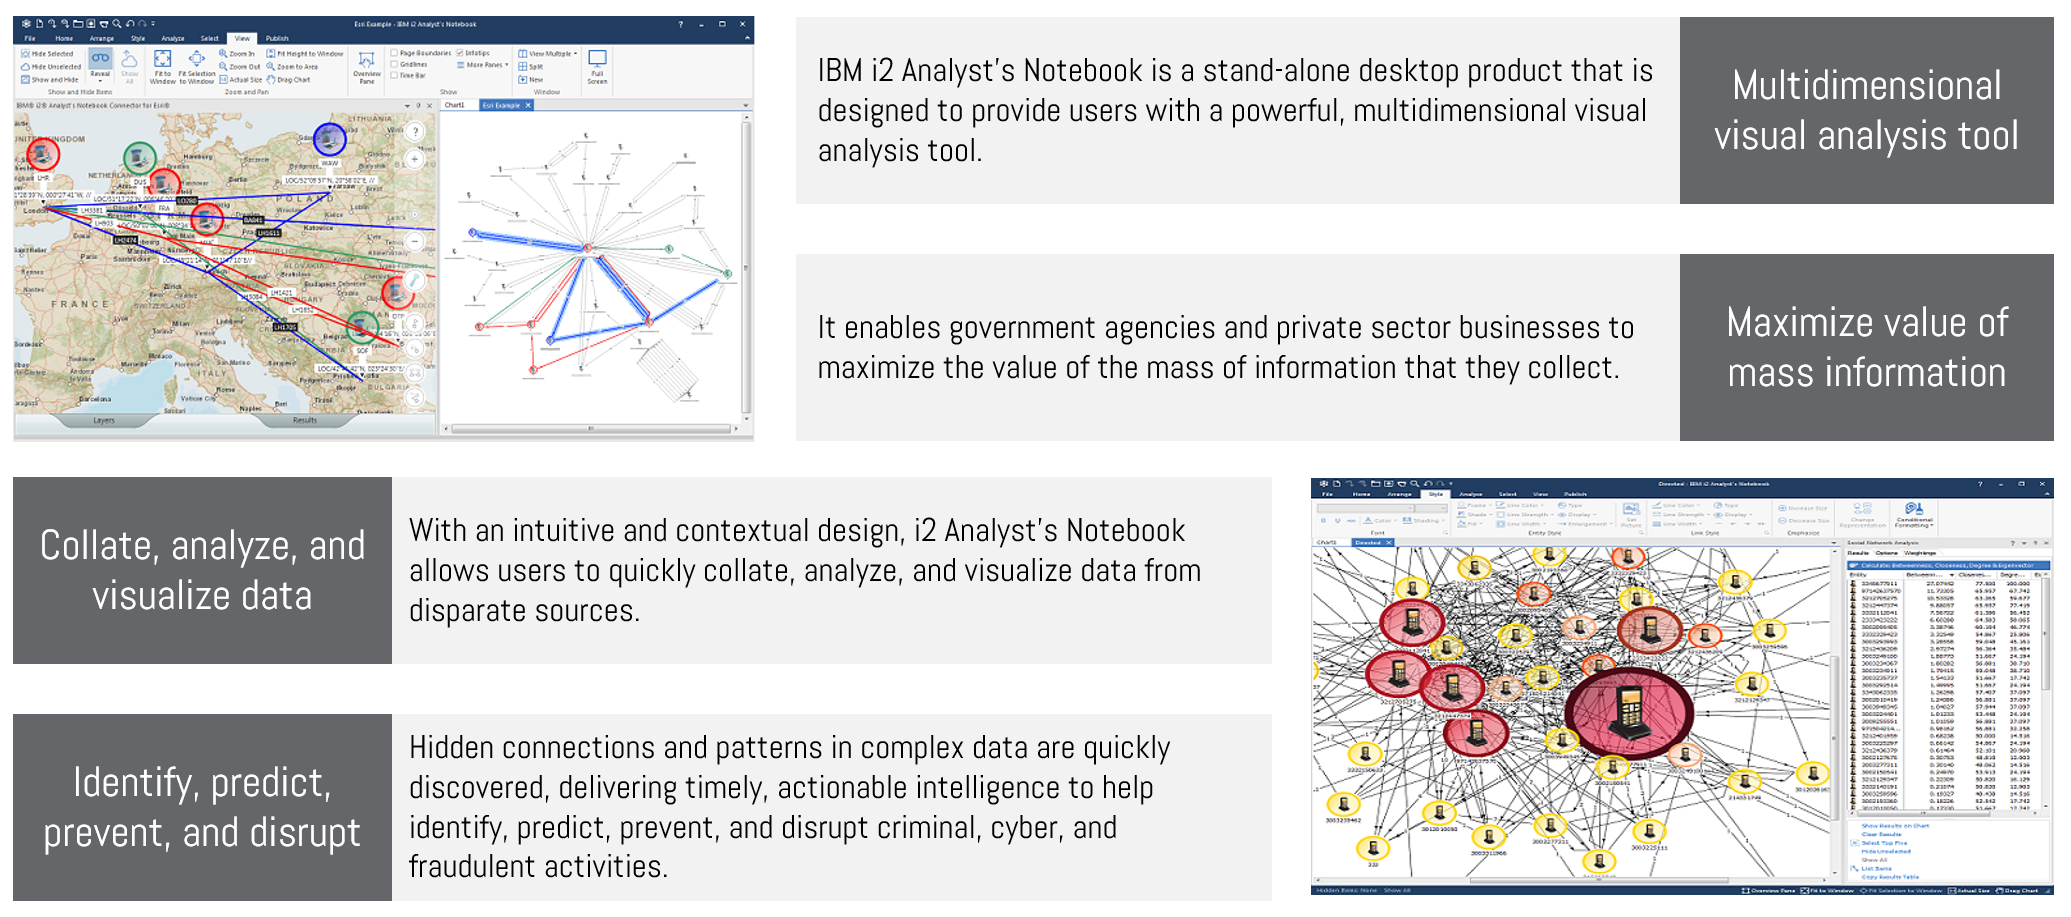
IBM® i2® Analyze is an enterprise intelligence analysis environment that facilitates information sharing and intelligence production with the flexibility of both web-based and rich desktop clients. It accelerates analysis of large volumes of data through an extensible, service-oriented environment, designed to integrate into your existing enterprise infrastructure, and simplify database…
Comments closed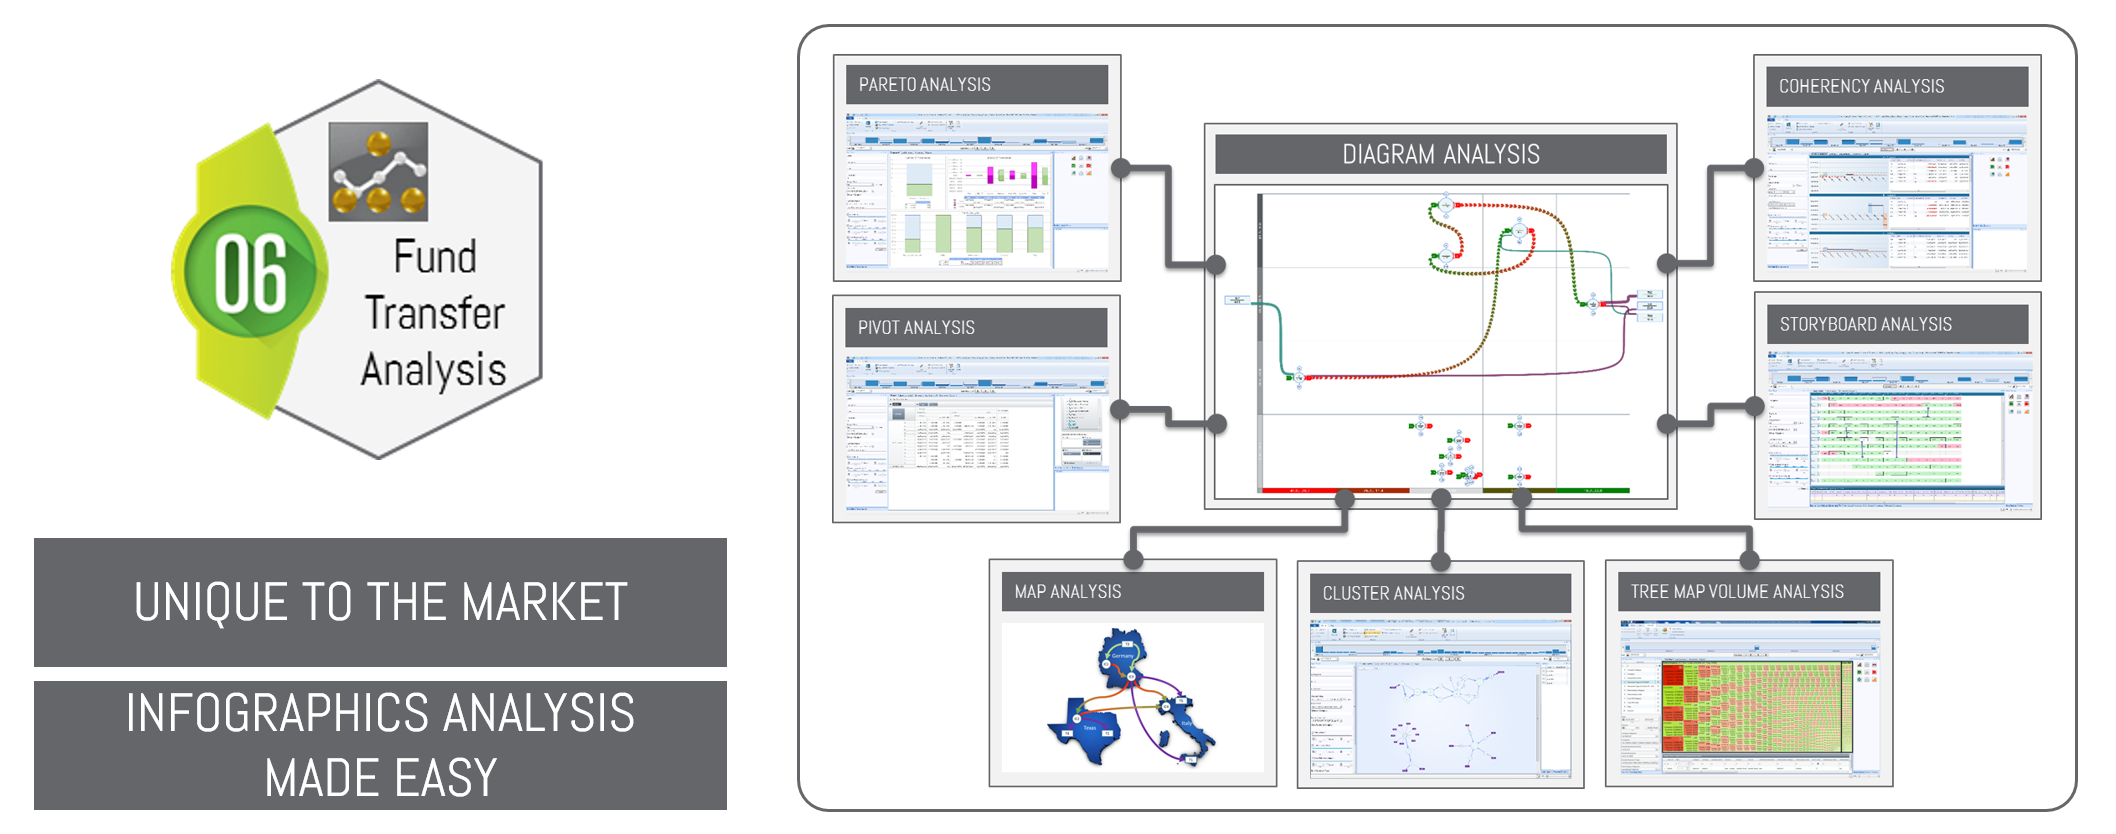
Infographic Solution To understand the real meaning of a series of movements within a complex system of financial transactions an infographic approach is the only solution. With our Console it’s possible to generate: Diagram Analysis Pareto Analysis Pivot Analysis Map Analysis Tree Map Analysis Coherency Analysis Storyboard Analysis Cluster…
Comments closed