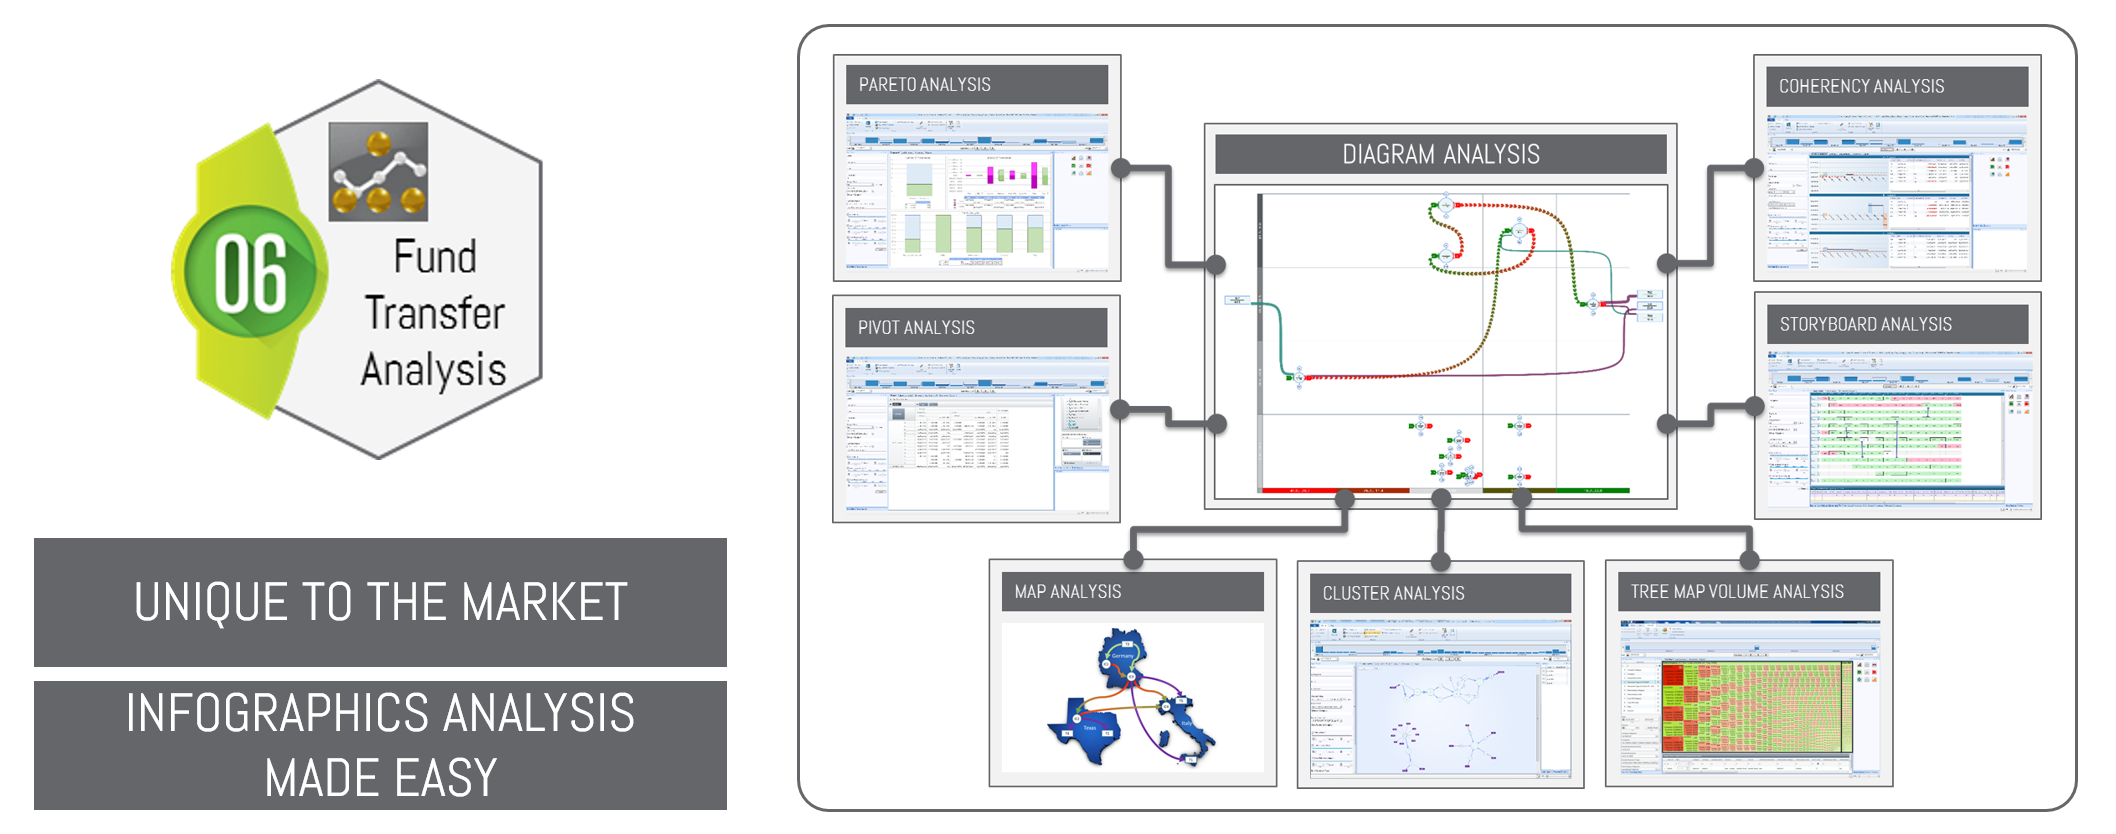
Infographic Solution To understand the real meaning of a series of movements within a complex system of financial transactions an infographic approach is the only solution. With our Console it’s possible to generate: Diagram Analysis Pareto Analysis Pivot Analysis Map Analysis Tree Map Analysis Coherency Analysis Storyboard Analysis Cluster…
Comments closed